Анализ цен на BTC на 6 мая
Текущий тренд и ценовой диапазон BTC
На рисунке 1 показан ежедневный график тенденций BTC/USDT. Изображение ясно показывает, что после касания ценовой зоны сопротивления, указанной белой горизонтальной зоной давления, в мае 2025 года цена сразу же испытала значительное откат. Следует отметить, что в феврале 2025 года цена также пережила период консолидации около этого диапазона. В будущем следует обращать внимание на объем торгов и на то, делает ли ценовая тенденция прорыв или опускается ниже диапазона консолидации.

(Рисунок 1, Источник: TradingView 2025.5.6)
BTC Фокус на и целевая цена
Вторая фигура показывает четырехчасовой график тенденции уровня BTC/USDT. Белая зона на графике можно рассматривать как ключевую зону сопротивления, а желтая восходящая линия тенденции является важной поддержкой на короткое время, а зеленая горизонтальная линия формирует нижнюю поддержку текущего диапазона консолидации. В будущем, если цена упадет ниже желтой линии тенденции, важно обратить внимание на уровень поддержки около 92 700. Если эта поддержка будет нарушена, цена может дальше протестировать около 91 000; наоборот, если цена сможет прорвать зону сопротивления около 96 000, фокус можно сосредоточить на целевом диапазоне 98 000 - 100 000.
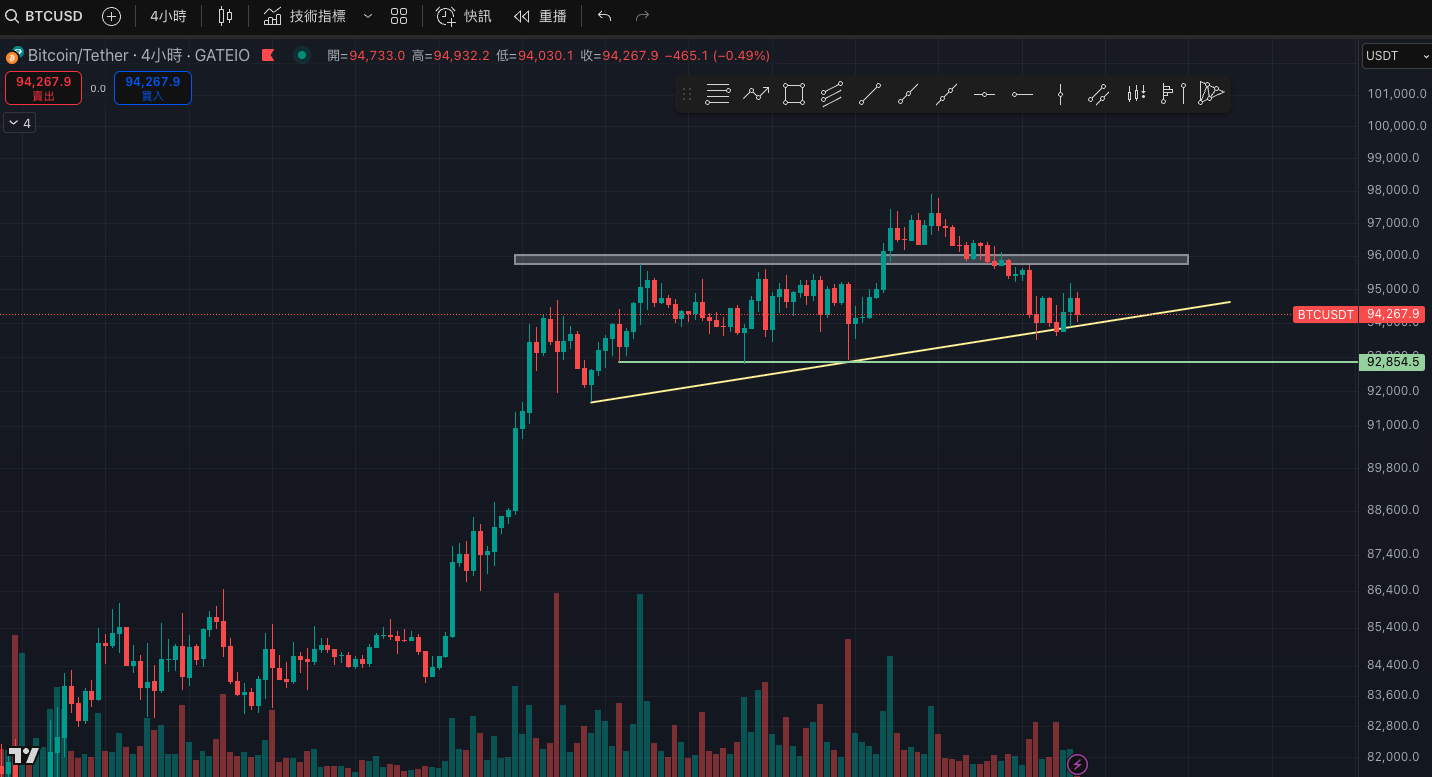
(Рисунок 2, Источник: TradingView 2025.5.6)
Начните торговлю BTC на спотовом рынке:https://www.gate.io/trade/BTC_USDT
Сводка
BTC перед глазами находится на ключевой испытательной стадии давления. Если цена не сможет эффективно удерживаться выше диапазона в $96,000, все еще есть возможность повторного тестирования поддержки на уровне $92,700 до $91,000 в краткосрочной перспективе. После успешного преодоления зоны давления ожидается, что рыночный импульс повысится до целочисленного уровня $98,000 до $100,000. Пока тенденция не станет ясной, следует продолжать наблюдать за объемом торгов и ценовым поведением и принимать более осторожную и гибкую стратегию в ответ.
Похожие статьи

Понимание токена TRUMP в одной статье: Комплексный анализ токена $TRUMP

Что такое MELANIA: мем-монета на миллиард долларов, запущенная первой леди США

Значение криптовалюты Pi: запуск основной сети 20 февраля 2025 года и прогнозы будущей цены

Как отследить транзакцию USDT BEP20?

Прогноз цены Solana на 2025 год: ключевые факторы, влияющие на рыночные тенденции и производительность
