Introduction to Chart Patterns: Key Techniques for Reading Market Trends
What is a chart pattern?
Chart patterns are specific formations used in technical analysis to identify price trends, reflecting the psychological and emotional changes of market participants. Through these patterns, traders can predict possible price reversals or continuations, thereby optimizing their buying and selling timing.
Common types of market trends
Market prices mainly show three trends: an upward trend (prices continuously reach new highs), a downward trend (prices continuously reach new lows), and a sideways trend (prices fluctuate within a range). Different trends require different chart patterns and trading strategies.
Important classic chart patterns
Double tops and double bottoms typically signal a trend reversal, while head and shoulders patterns are reliable reversal signals. Triangle patterns indicate that prices are converging, which may lead to a breakout, whereas flags and wedges are often signals of trend continuation.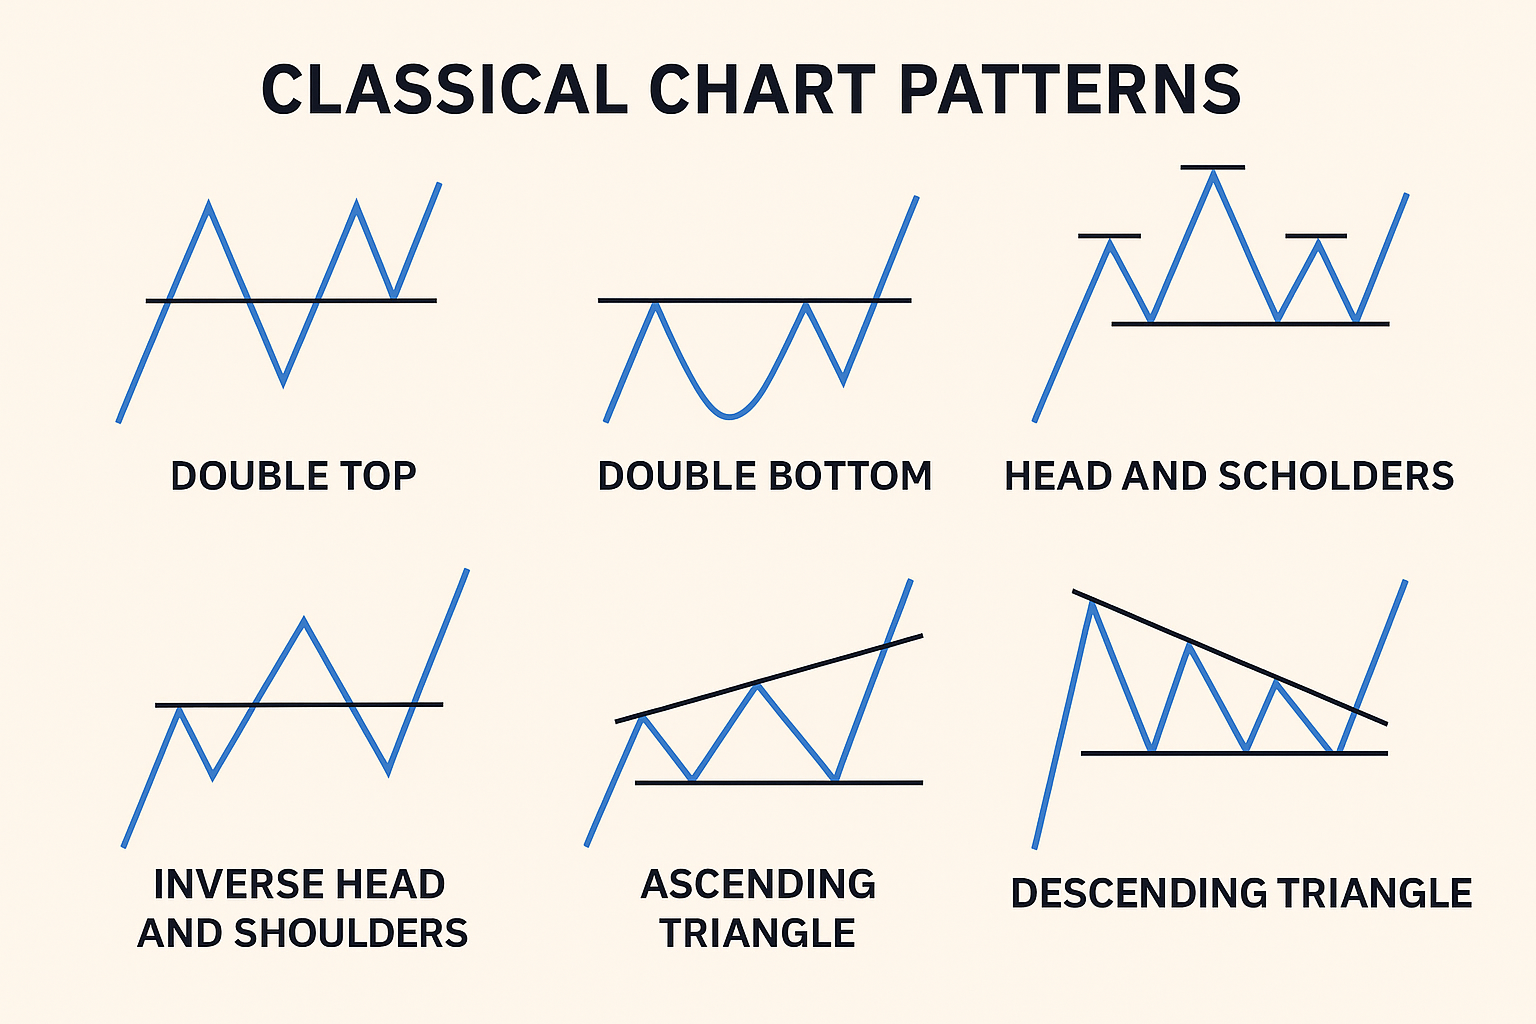
Judgment methods combining technical indicators and charts
Relying solely on graphics is not precise enough; technical indicators such as trading volume, moving averages (MA), and the relative strength index (RSI) can assist in confirming the validity of breakouts and the direction of trends. This comprehensive analysis increases the success rate of trading decisions.
Common Mistakes and Suggestions for Beginners
Over-reliance on charts, neglecting market context and news, as well as entering the market too early are common mistakes. It is recommended to practice historical chart analysis, review trades afterwards, and strictly implement risk control and stop-loss strategies. Choose a safe and liquid trading platform like Gate for practical operations.
Conclusion
Mastering chart patterns is an important step in enhancing trading judgment. Understanding the market sentiment and structure behind the price helps in finding opportunities amidst volatility. Start practicing chart analysis to bring you closer to the goal of accurately grasping market trends.
Note: The chart analysis described in this article is for reference only. The cryptocurrency market is highly volatile, please trade cautiously and be aware of the risks.