MatthewDixon
No content yet

- Reward
- like
- Comment
- Share
- Reward
- like
- Comment
- Share
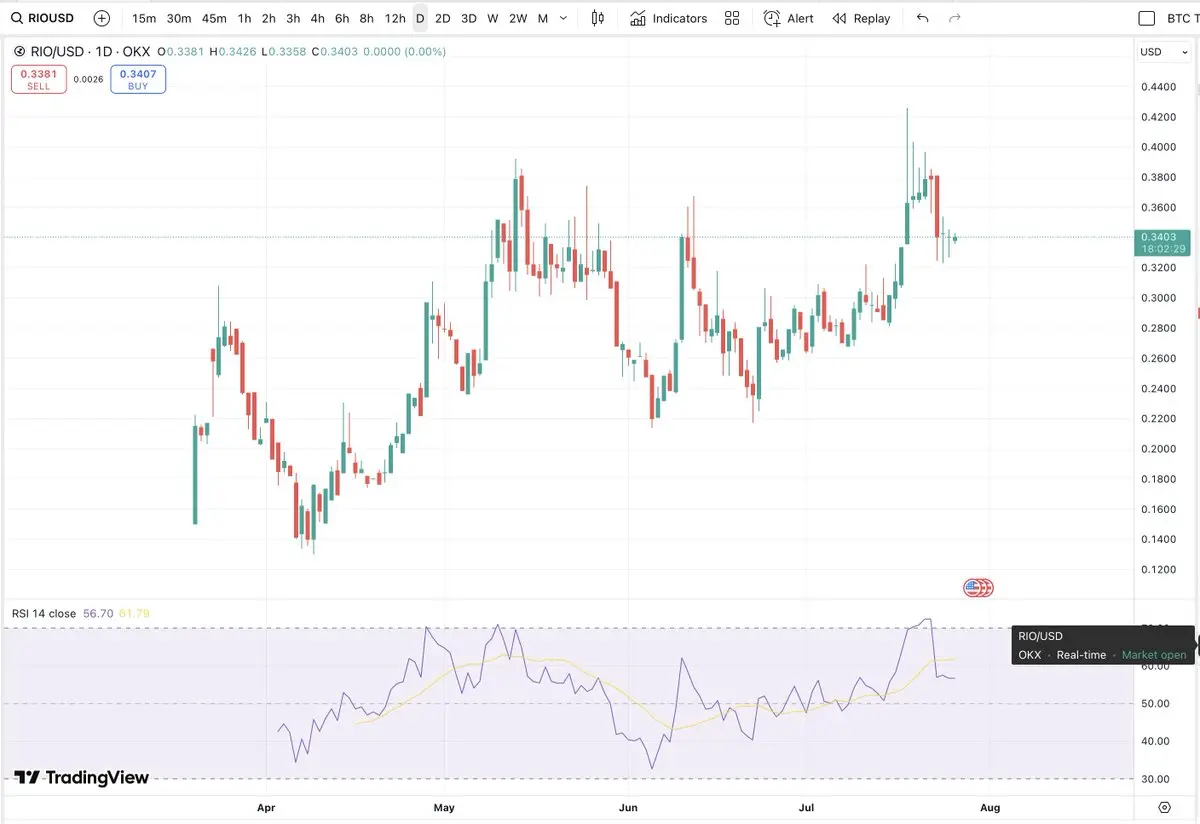
#RIO# chart shows a series of higher lows and higher highs since mid-June, suggesting a short-term bullish trend.
There isnt really enough price history so I will give a general TA overview.
The recent breakout above the $RIO $0.32–$0.34 consolidation area implies bullish momentum.
Recent Pullback:
Price spiked to $0.43 but pulled back quickly. This indicates profit-taking or rejection near short-term resistance.
The current price around $0.34 is stabilizing just above the previous breakout zone.
Structure:
If the $0.32–$0.34 range holds as support, this pullback could form a bullish flag or
- Reward
- like
- Comment
- Share
- Reward
- like
- Comment
- Share
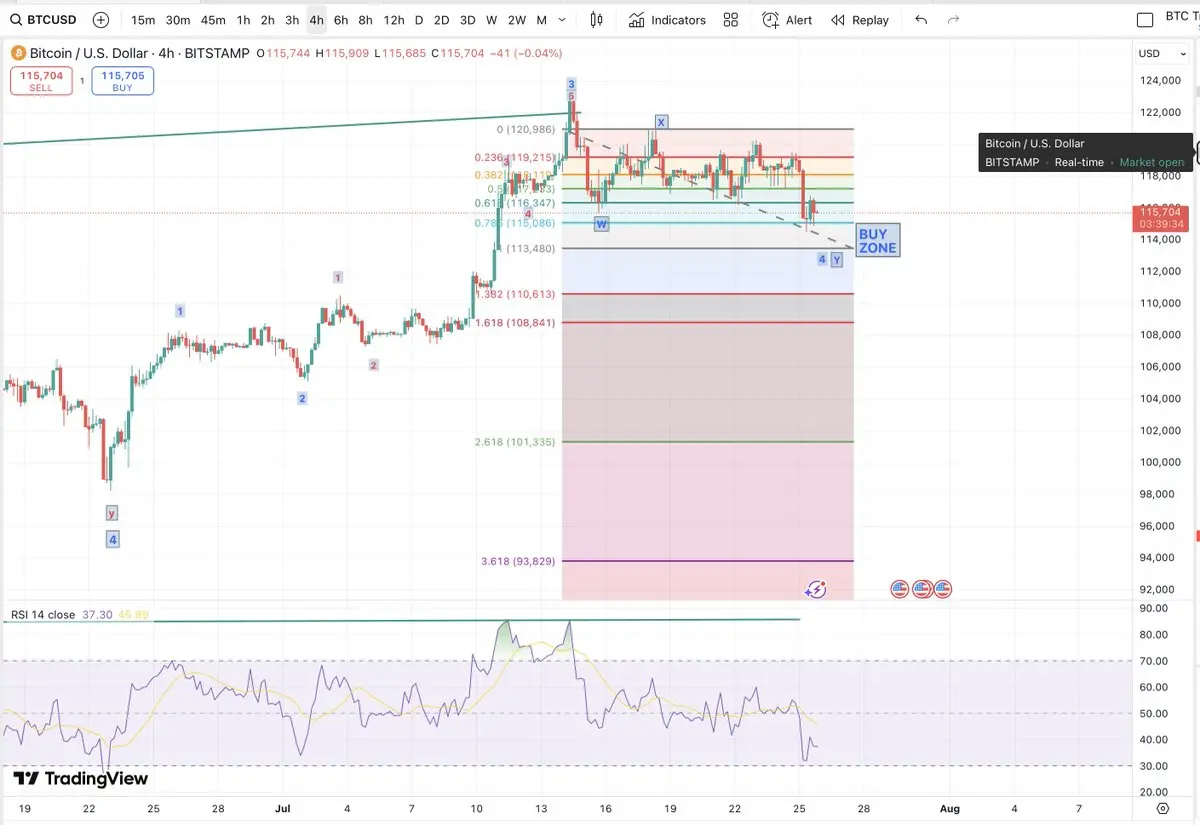
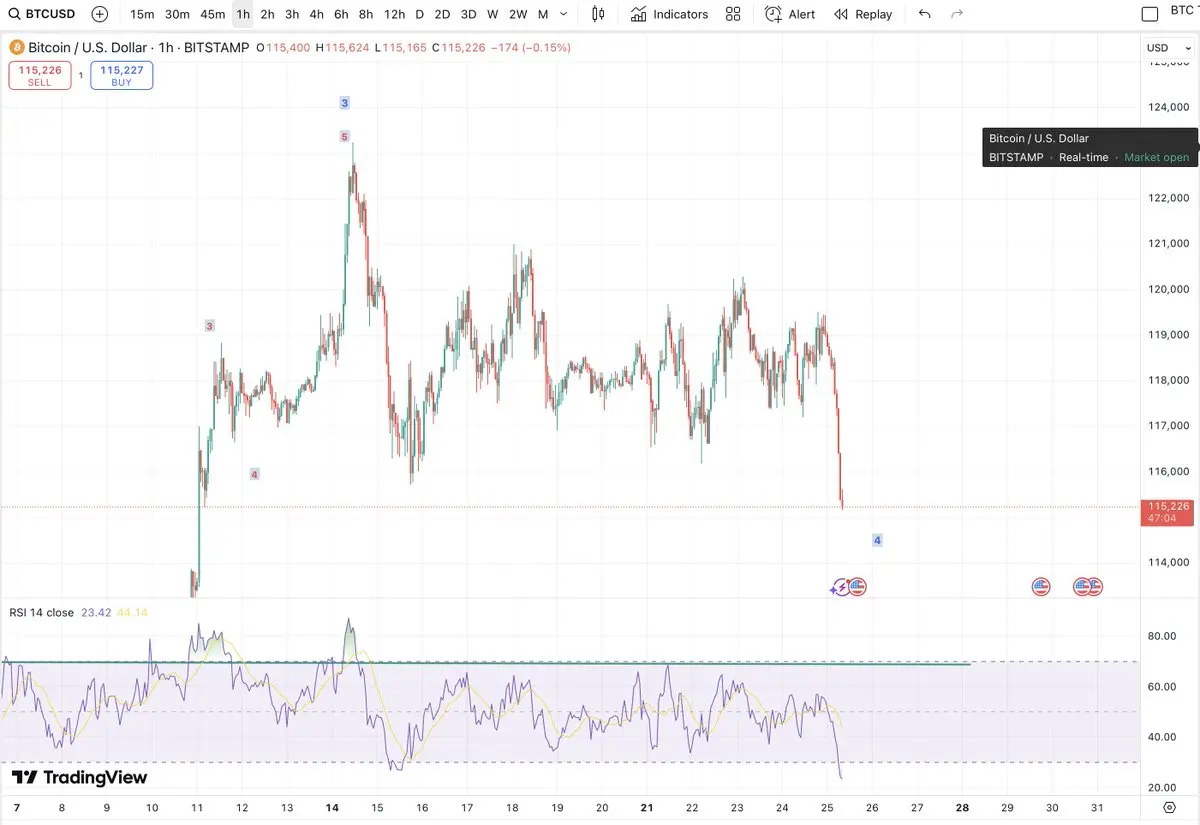
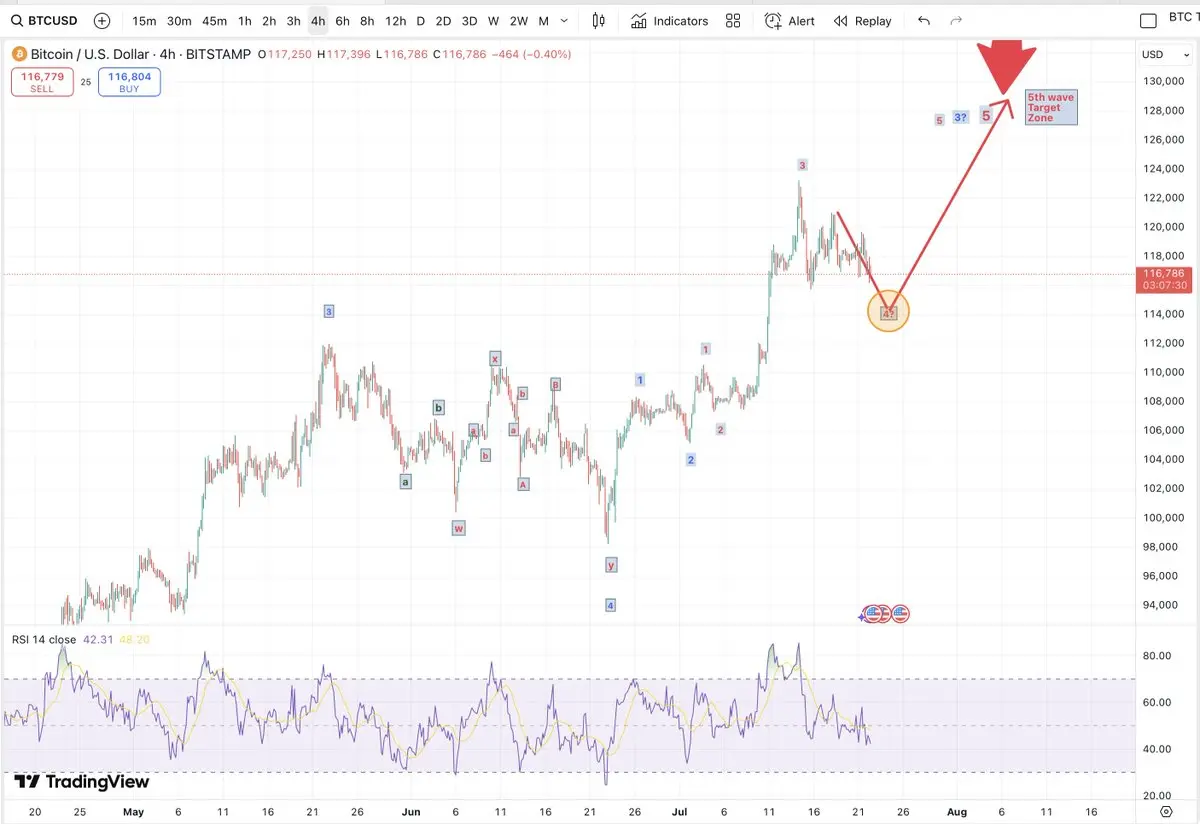
Thankfully none of my followers were caught by surprise by this snap correction.
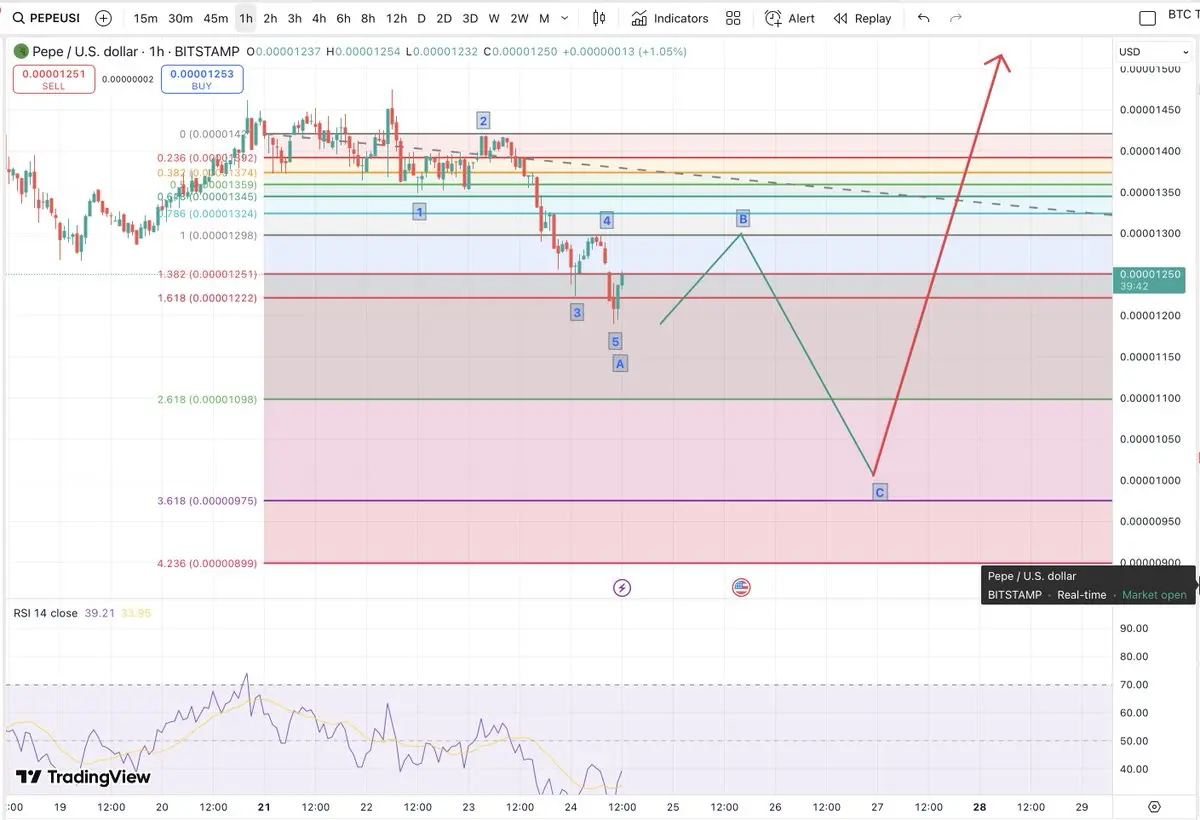
My daily Videos showed the way in advance. We detailed that $BTC $114 was an interesting area to watch and will update in today's video along with other tokens that have been requested #XRP# #PEPE# #VET # JASMY and more
My daily Videos showed the way in advance. We detailed that $BTC $114 was an interesting area to watch and will update in today's video along with other tokens that have been requested #XRP# #PEPE# #VET # JASMY and more
- Reward
- like
- Comment
- Share
Thankfully none of my followers were caught by surprise by this snap correction.
My daily Videos showed the way in advance. We detailed that $BTC $114 was an interesting area to watch and will update in today's video along with other tokens that have been requested #XRP# #PEPE# #VET # JASMY and more
My daily Videos showed the way in advance. We detailed that $BTC $114 was an interesting area to watch and will update in today's video along with other tokens that have been requested #XRP# #PEPE# #VET # JASMY and more
- Reward
- like
- Comment
- Share
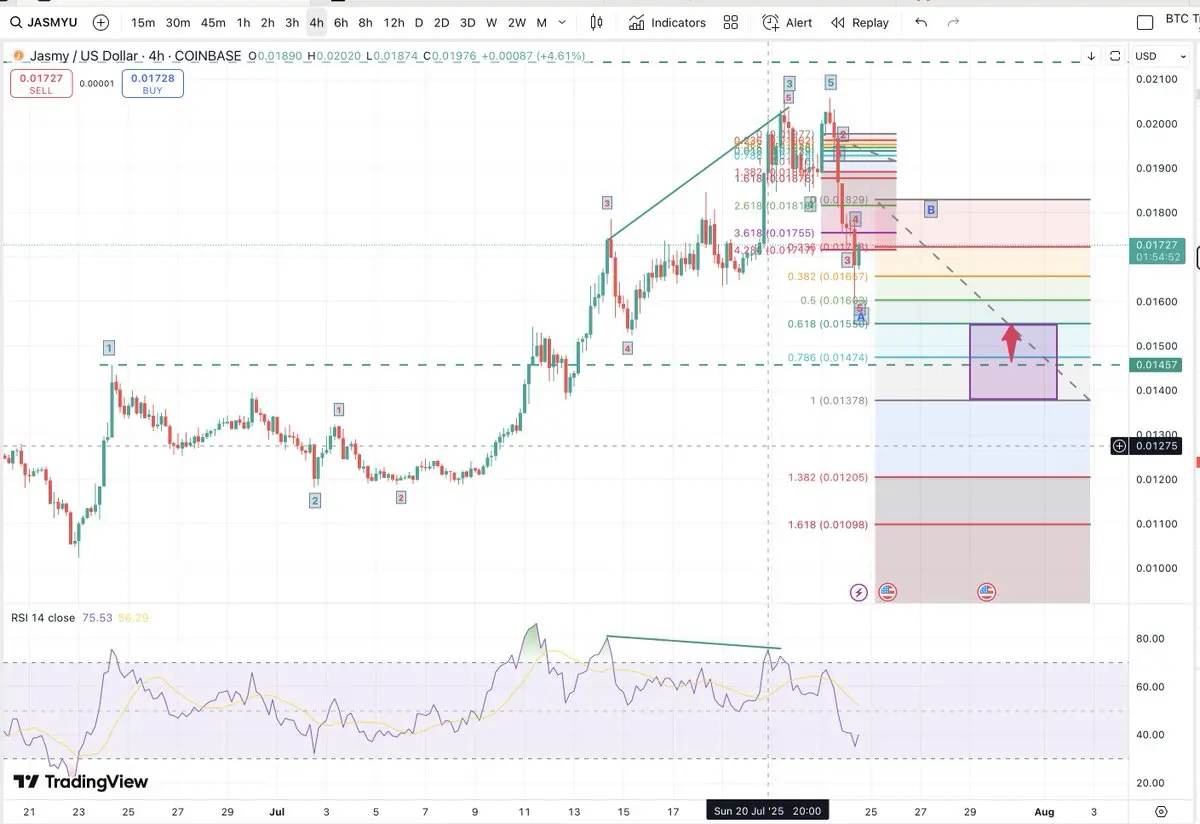
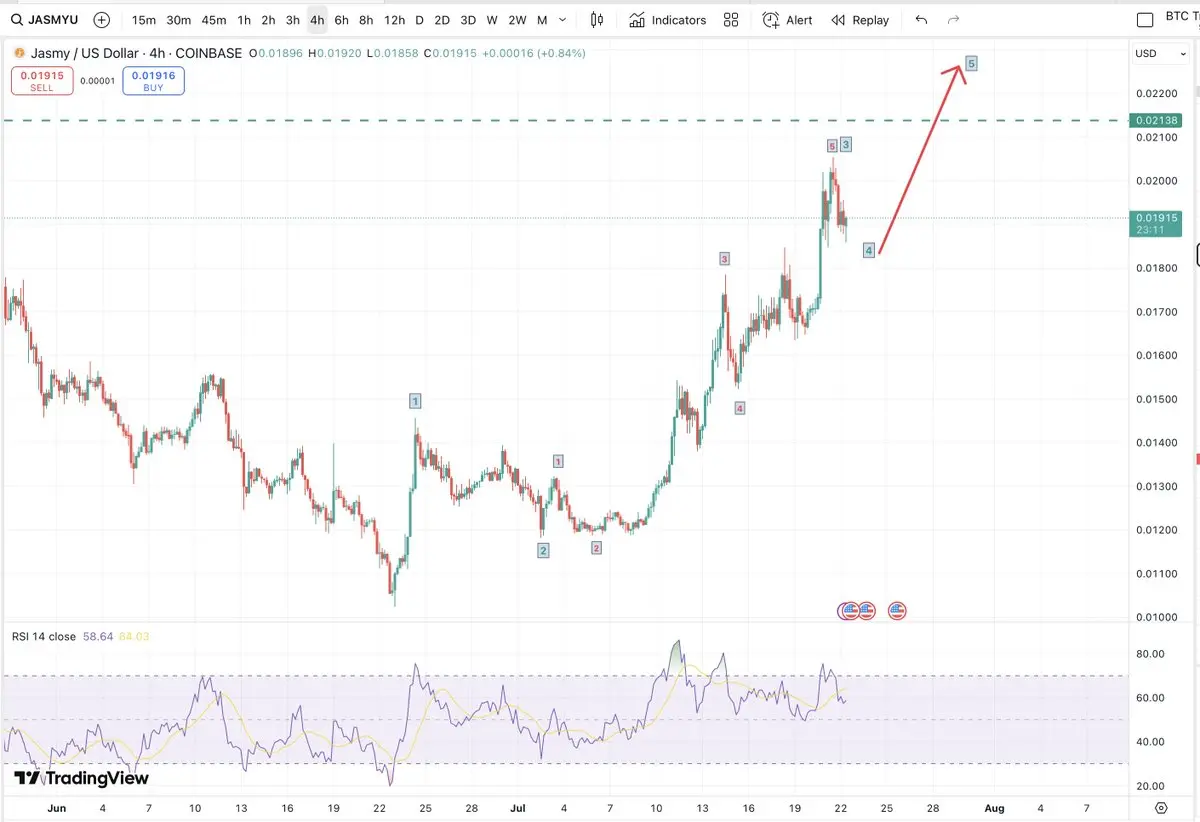
We need to await the end of the B wave and then we can more accurately calculate the wave C down end point for #JASMY# then we should move aggressively HIGHER
The end of the C wave would be a great place to build or rebuild long (Bullish) positions to benefit from expected $JASMY appreciation.
The end of the C wave would be a great place to build or rebuild long (Bullish) positions to benefit from expected $JASMY appreciation.
- Reward
- 1
- Comment
- Share
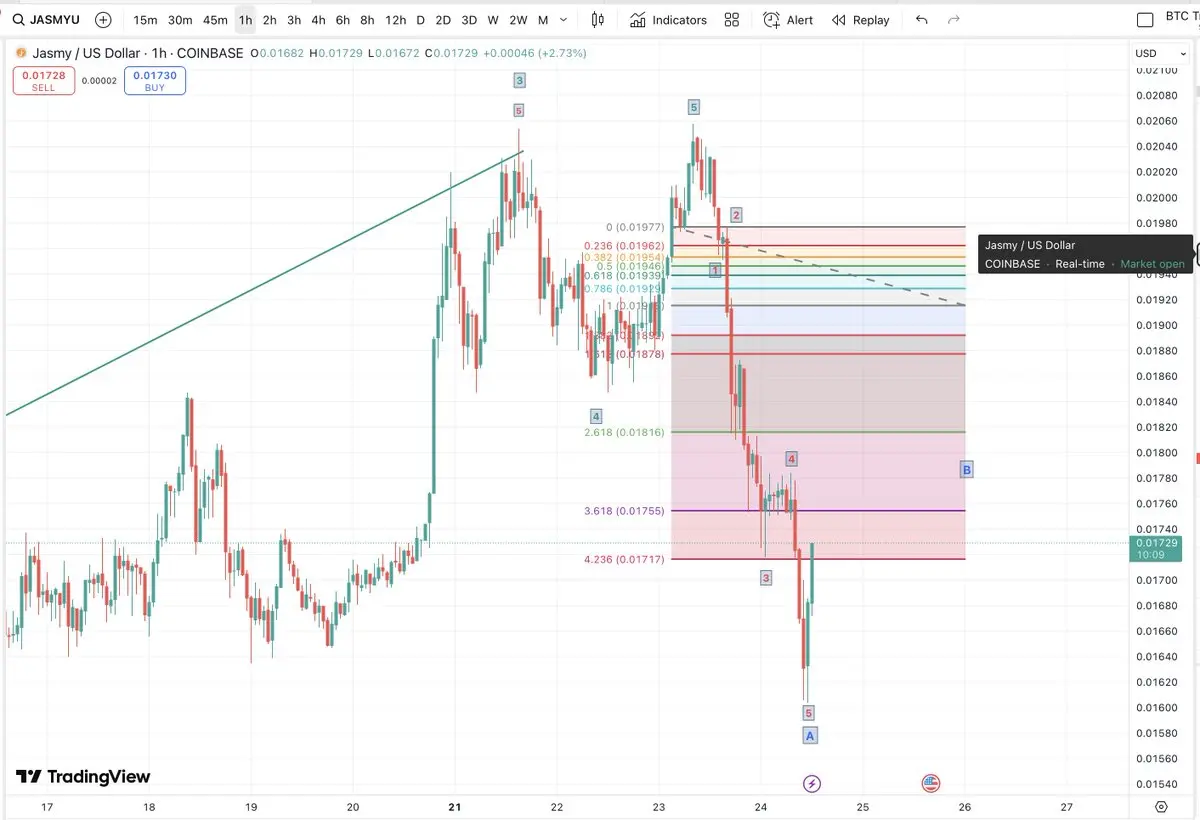
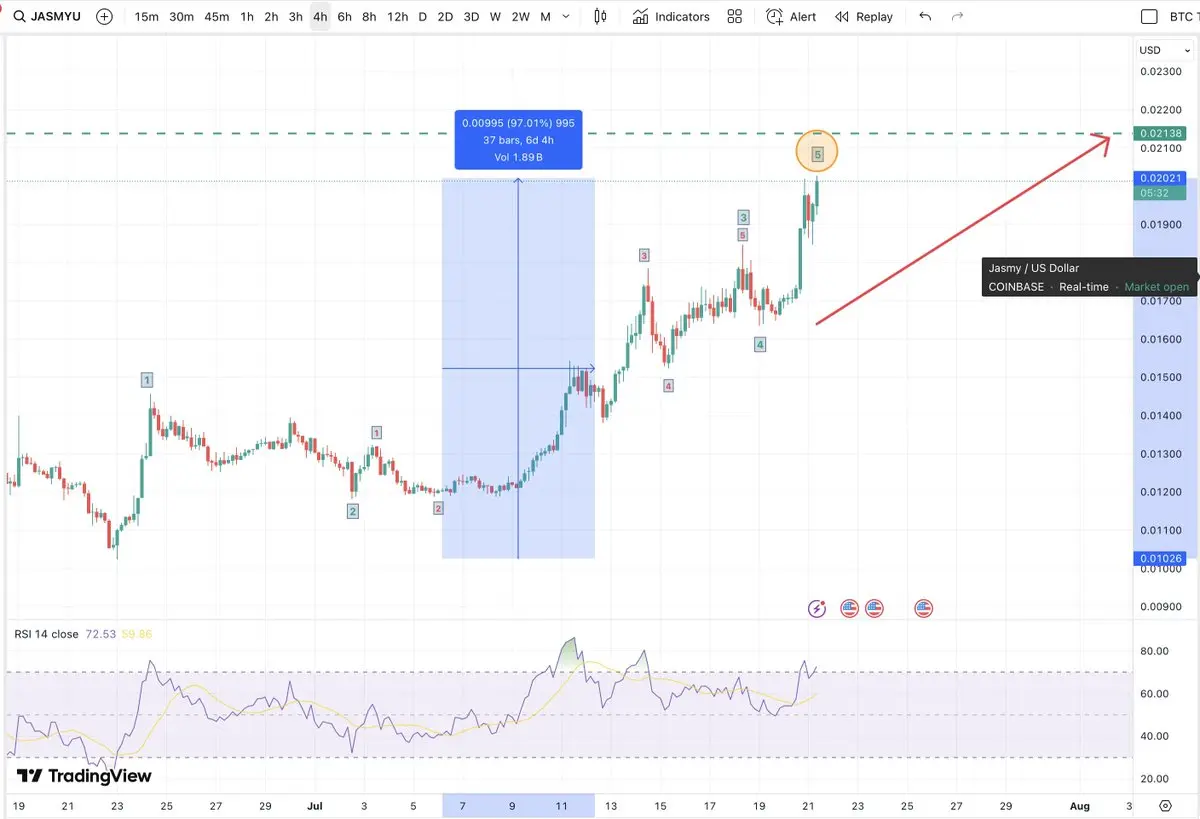
Spot on with #JASMY as we expected an end to this cycle higher as clear 5 wave impulse
We are now working on ABC correction down with the A wave already complete and within that A wave we see wave 3 with a nice #FIB 4.236 extension in relation to wave 1
B an C to go then up again
We are now working on ABC correction down with the A wave already complete and within that A wave we see wave 3 with a nice #FIB 4.236 extension in relation to wave 1
B an C to go then up again
- Reward
- 3
- Comment
- Share
- Reward
- like
- Comment
- Share
- Reward
- like
- Comment
- Share
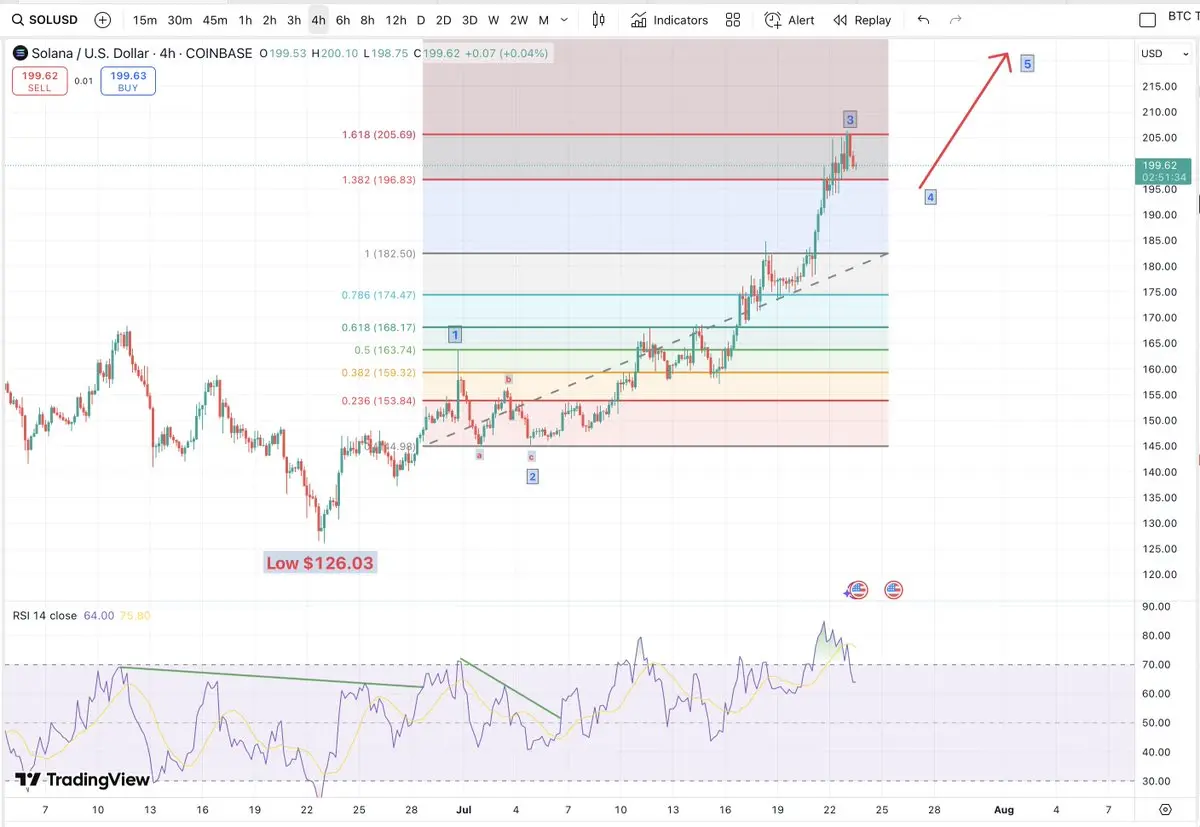
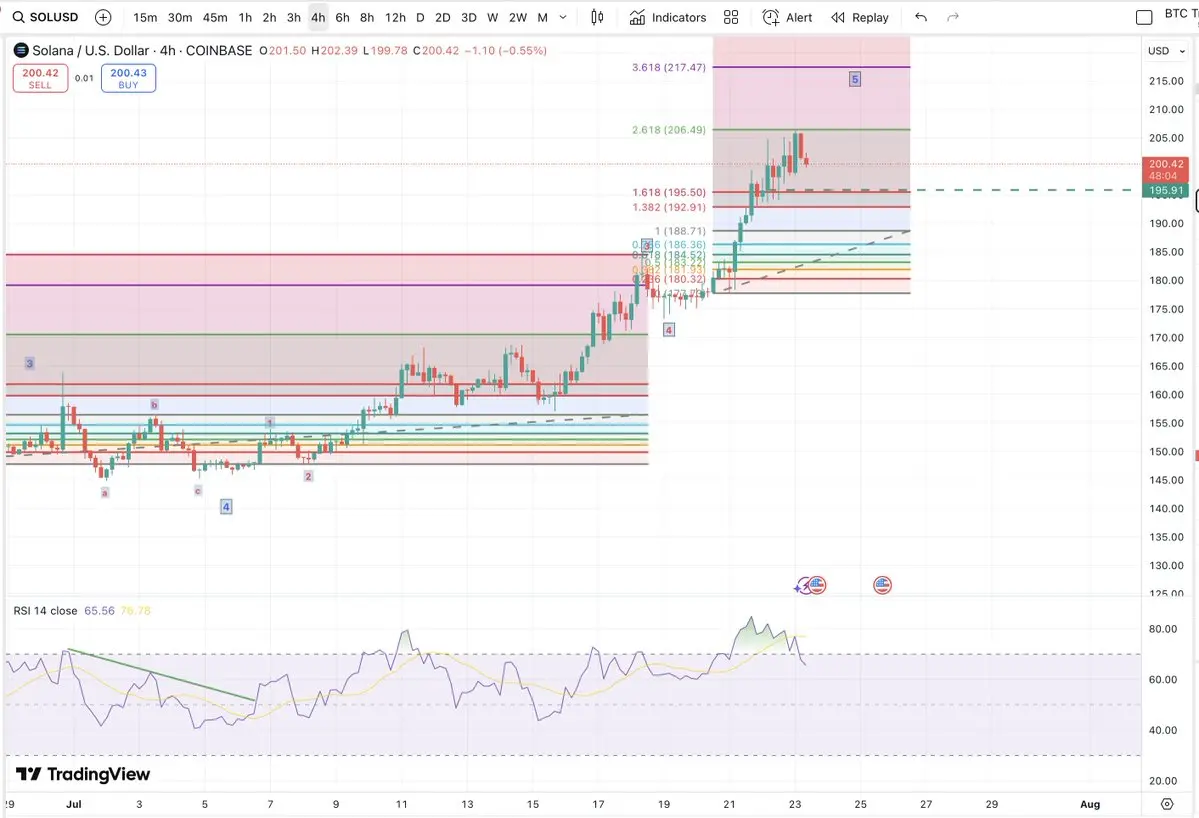
I have revised my #SOL count as shown which only modifies the internal count from the $SOL $126 low and STILL expects a further impulse higher to conclude this cycle before correction
SOL3.54%
- Reward
- like
- Comment
- Share
- Reward
- like
- Comment
- Share
- Reward
- like
- Comment
- Share
- Reward
- 3
- 1
- Share
HekouKing :
:
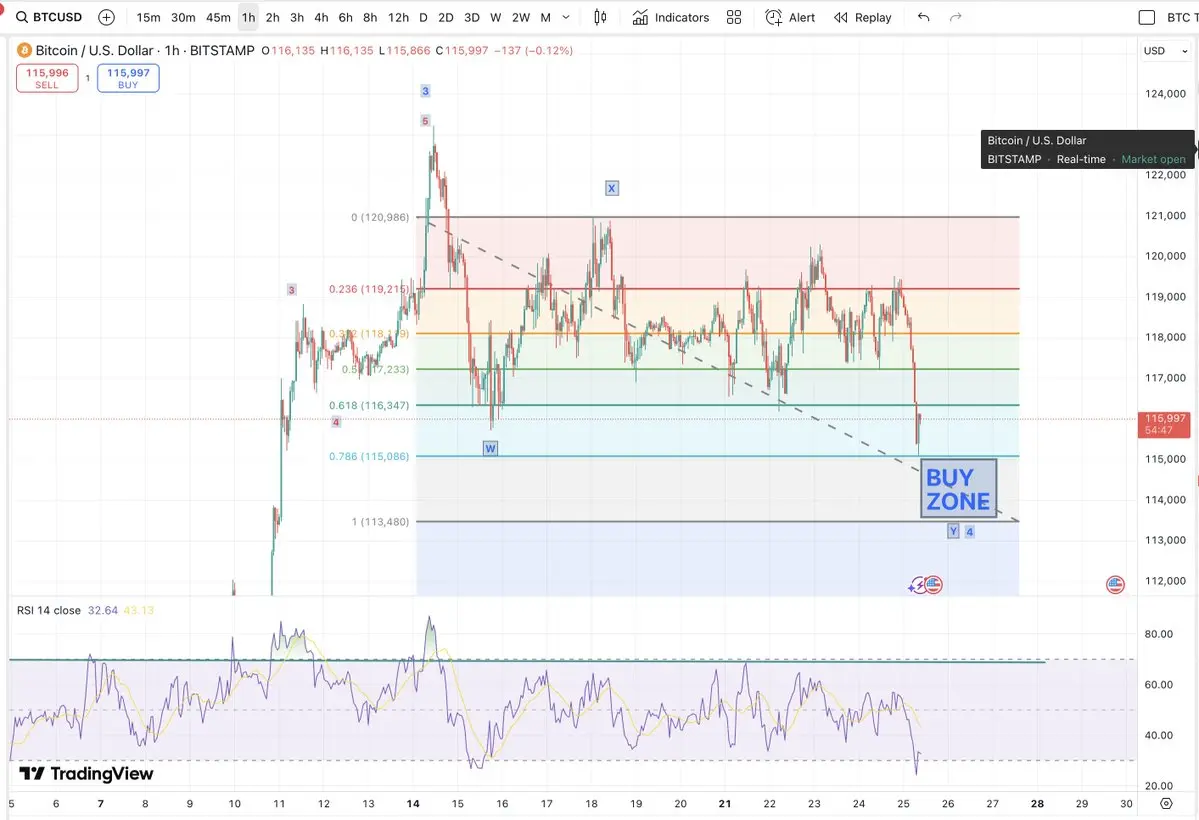
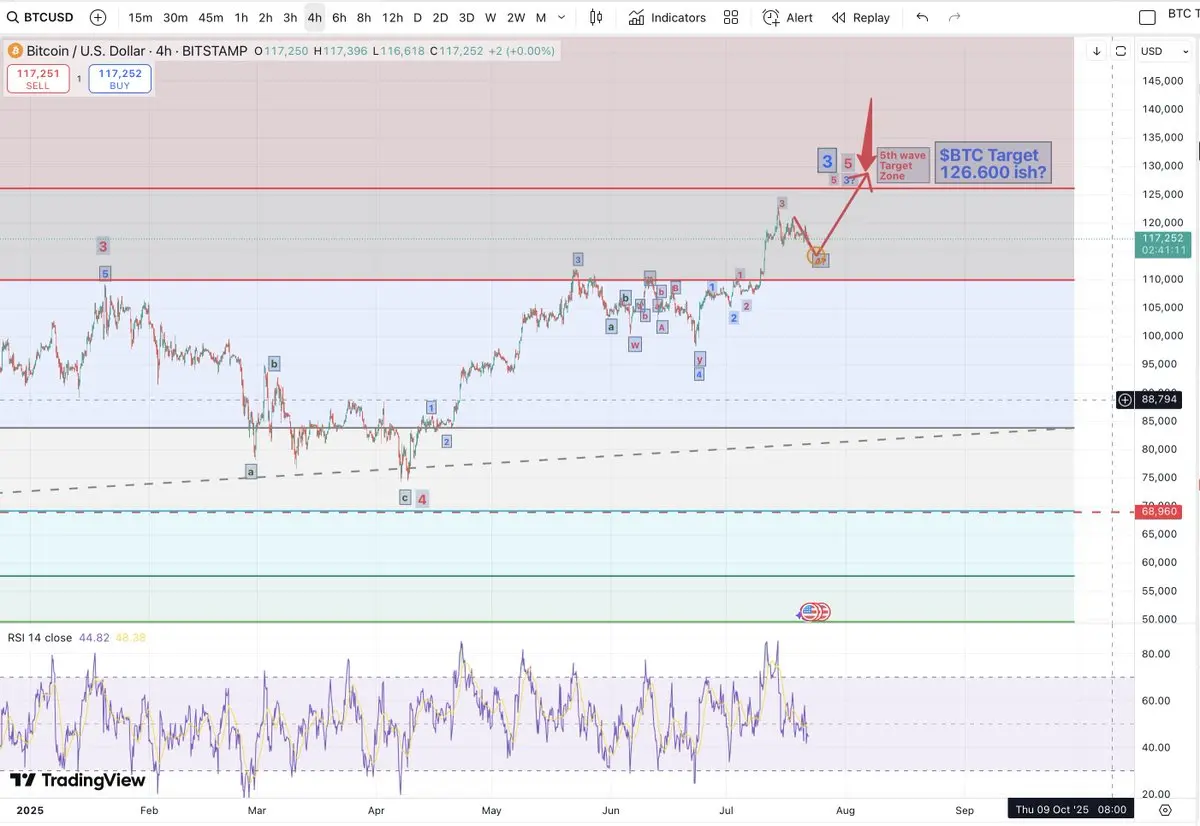
Just go for it💪I had this correction labelled in advance for #BTC and the # ALTs will follow suit.
Its not the end of the Bull-run but just a healthy and necessary correction which can enable further 'buy the dip' DCA opportunities as I will show in todays Video update to be posted soon.
Its not the end of the Bull-run but just a healthy and necessary correction which can enable further 'buy the dip' DCA opportunities as I will show in todays Video update to be posted soon.
- Reward
- like
- Comment
- Share
I had this correction labelled in advance for #BTC and the # ALTs will follow suit.
Its not the end of the Bull-run but just a healthy and necessary correction which can enable further 'buy the dip' DCA opportunities as I will show in todays Video update to be posted soon.
Its not the end of the Bull-run but just a healthy and necessary correction which can enable further 'buy the dip' DCA opportunities as I will show in todays Video update to be posted soon.
- Reward
- like
- Comment
- Share
#JASMY is currently uo 97% since we began tracking this impulsive cycle higher, beginning 23rd June (less than one month)
Once this impulsive cycle is complete, we should expect a MODEST correction before impulsively higher again.
Once this impulsive cycle is complete, we should expect a MODEST correction before impulsively higher again.
JASMY0.21%
- Reward
- 4
- Comment
- Share